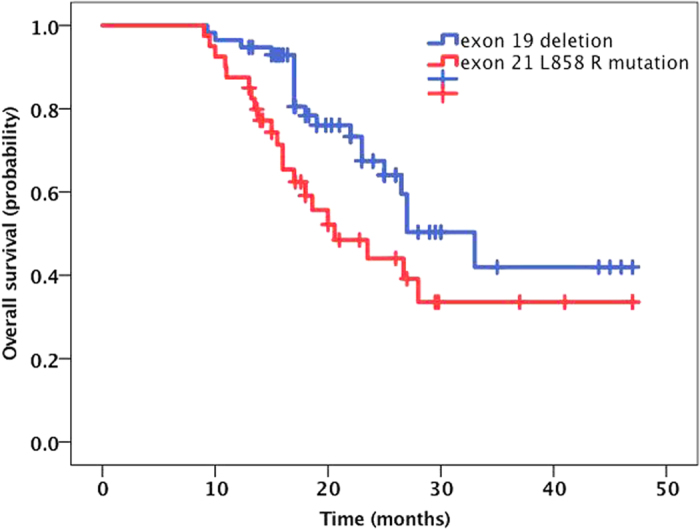
Figure 3. The Kaplan-Meier curve for OS between different mutant groups.

The median OS was 32.7 months (95% CI 28.1–37.3) in the EGFR del19 mutation group and 27.4 months (95% CI 22.1–32.7) in the exon 21 L858R group (P = 0.037).

The median OS was 32.7 months (95% CI 28.1–37.3) in the EGFR del19 mutation group and 27.4 months (95% CI 22.1–32.7) in the exon 21 L858R group (P = 0.037).