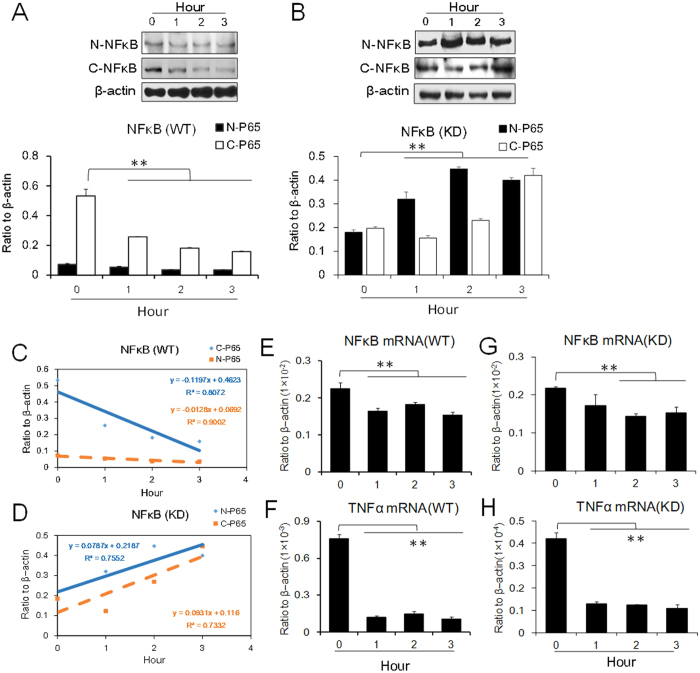
Figure 6. Protein expression of NFκB in PC12 cells under cold conditions (4 °C).
(A,B) NFκB in the cytoplasm and in the nucleus. (A) WT represents wild type cells. (B) KD represents Trpm8 knockdown cells. (C,D) Kinetic expression levels of NFκB in both WT and KD cells. C-P65 represents NFκBp65 in the cytoplasm. N-P65 represents NFκBp65 in the nuclei. (E–H) The mRNA expression levels of NFκB and TNFα after JSH-23 (8 μM), the inhibitor of NFκB, was applied. (E,F) WT cells. (G,H) KD cells. Data are shown as the mean ± S.D. from three experiments. **P < 0.01, v.s. the control (zero time).

