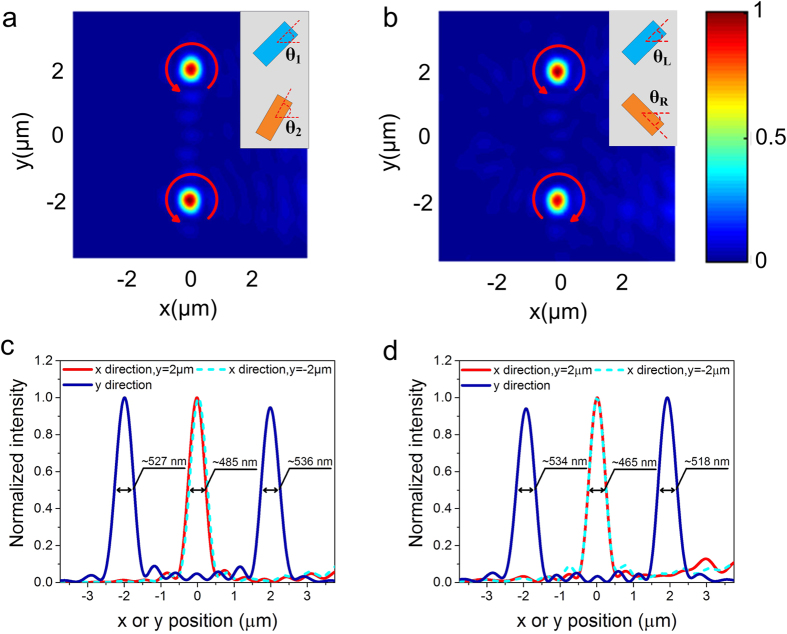
Figure 5. Simulated electric intensity distribution of the reflected beam (f = 5 μm).
(a) Two focal points with the same chirality formed by meta-molecule achiral lens (Two kinds of nanofins showed in Fig. 4(a) with the same rotational directions). The oblique incident beam is RCP light. The distance between the two focal points is 4 μm. The red arrow represents helicity of focused light. (b) Two focal points with the opposite chirality formed by meta-molecule chiral lens (Two kinds of nanofins showed in Fig. 4(a) with opposite rotational directions). The oblique incident beam is linear polarized light. (c) and (d) Corresponding normalized intensity cross-sections at the flat lens’s focal spots along the x and y axis for the same chirality (c) and opposite chirality (d). FWHMs of the focal spots are labelled on the plots.

