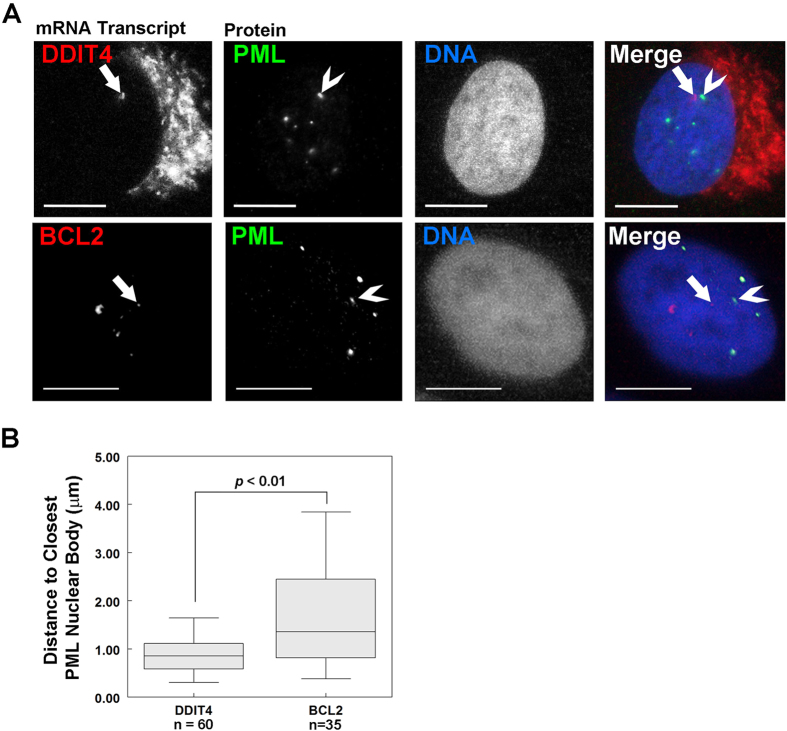
Figure 4. DDIT4 gene expression occurs near PML NBs.
(A) U2OS cells were fixed and prepared for RNA FISH. DDIT4 and BCL2 mRNA (red) and PML NBs (green) are shown. DNA was visualized with Hoechst 33342. Arrows indicate transcriptional foci (red) and chevrons (>) indicate the nearest PML NB (green) to the foci. Scale bar = 5 μm. (B) Box and whisker plots showing the median and distribution of shortest distances between a PML NB and the indicated transcriptional foci (n = 30 nuclei).

