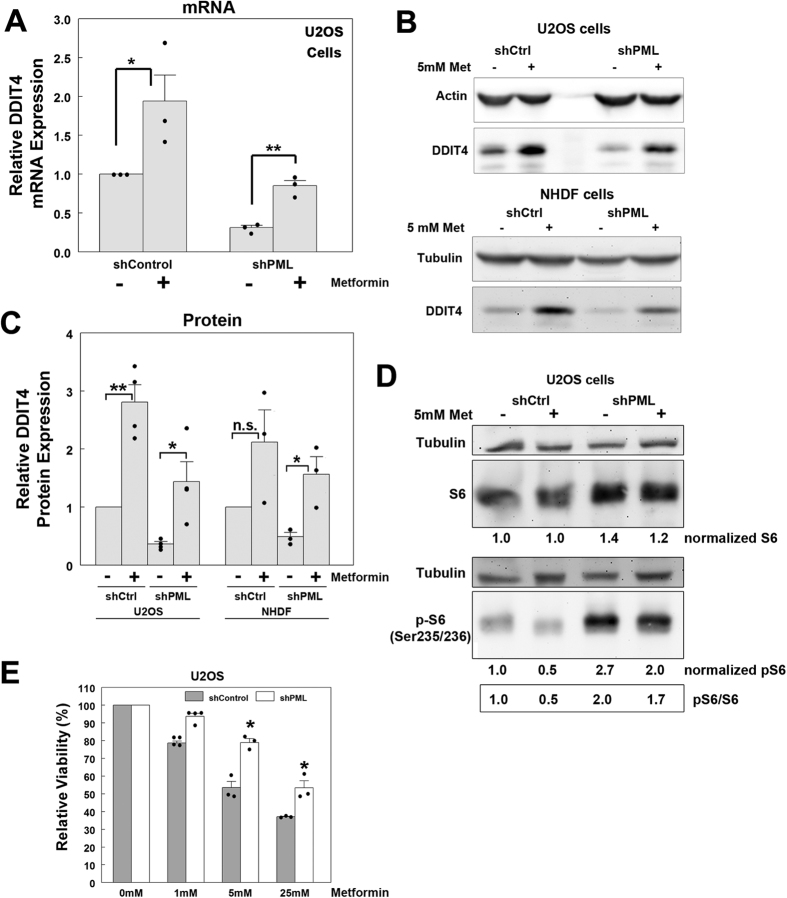
Figure 6. Metformin upregulates DDIT4 expression independent of PML.
(A) Quantitative PCR analysis of DDIT4 mRNA expression in shControl and shPML cells treated with 5 mM metformin for 24 h (n = 3). (B) Western blot analysis of DDIT4 expression in shControl and shPML U2OS and NHDF cells treated with 5 mM metformin for 24 h. (C) Relative DDIT4 protein expression in metformin-treated U2OS (n = 4) and NHDF (n = 3) cells treated as in A. (D) Western blot analysis and densitometry of S6 and phospho(Ser235/236) S6 levels in shControl and shPML U2OS cells treated with 5 mM metformin for 24 h. (E) Relative cell viability for shControl and shPML cells treated with the indicated doses of metformin for 72 h (n = 3). For (A,C and E), values represent the mean+/−SEM. p-values < 0.01 (**) or <0.05 (*) and n.s. = not significant. Full-length blots for this figure are presented in Supplementary Figure 6.

