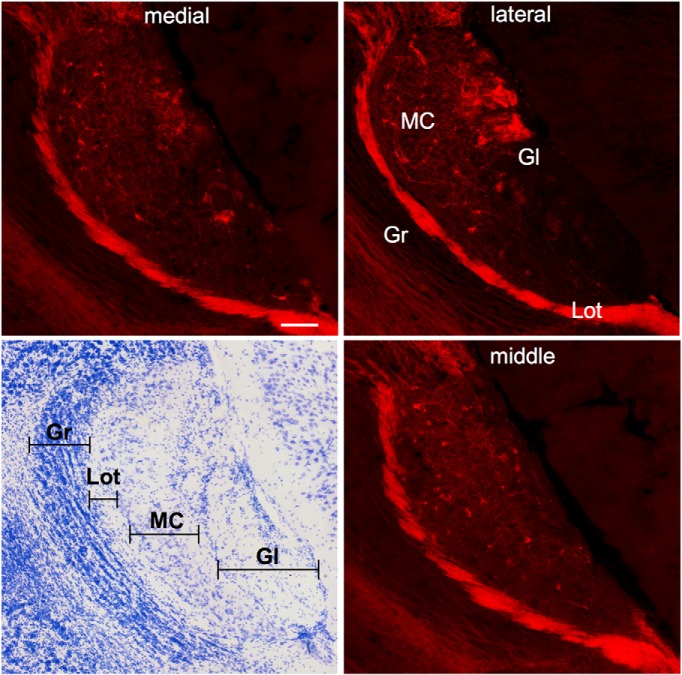
Figure 1.
Examples of the distribution of ChR2-mCherry-infected mitral cells in the AOB in three sagittal sections from medial, middle, and lateral regions of a single representative AOB. mCherry-labeled cells and fibers can be seen throughout the mitral cell layer, and fibers are also prevalent in the glomerular layer (Gl) and lateral olfactory tract (Lot). A photomicrograph of a Nissl-stained section from the AOB is shown on the bottom left panel. Gr, granule cell layer; MC, mitral cell layer. Scale bar = 100 microns.

