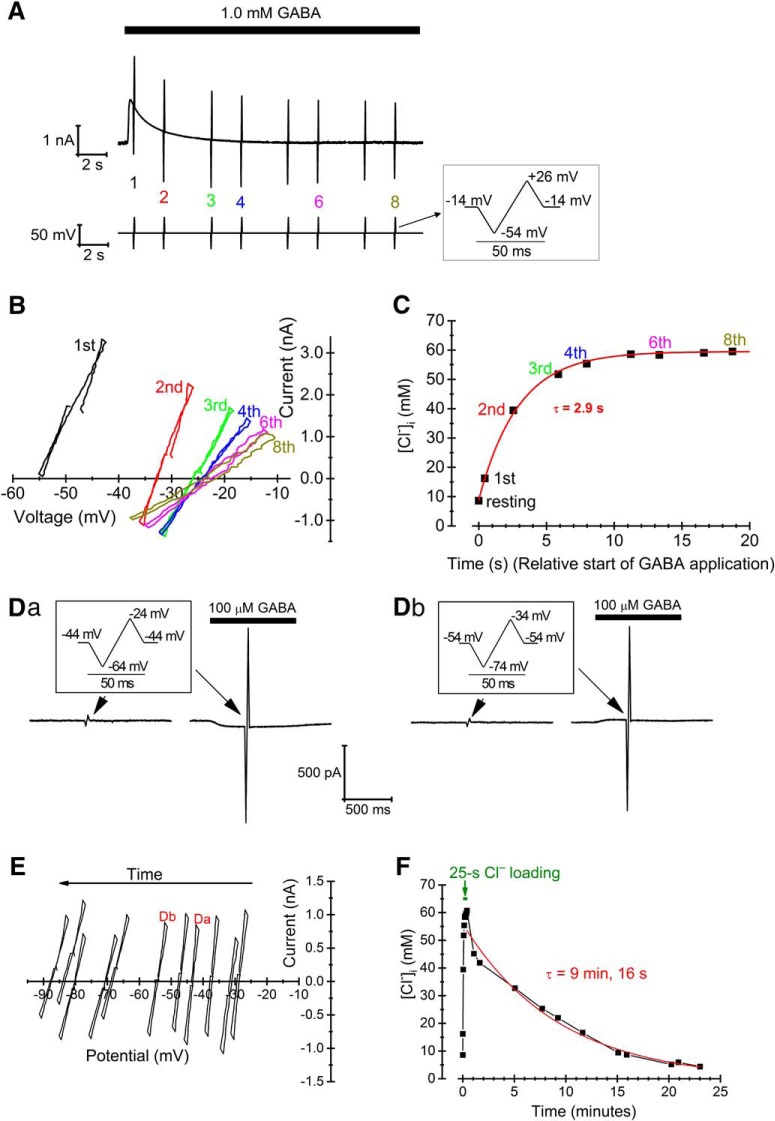
Figure 2.
[Cl–]i loading and estimation of transporter-dependent recovery capacity. A, Voltage protocol (bottom) and recorded current (top) during loading a cell with Cl–. Note that the baseline voltage during loading was –14 mV to obtain a large driving force for Cl– current evoked by 1.0 mM GABA. Data from numbered ramps are shown in B and C. B, I-V relations corresponding to the ramps (no 1-4, 6, 8, as marked in A) applied during Cl– loading (corrected for series resistance and with leak components subtracted). C, Time course of [Cl–]i during Cl– loading, as computed from ECl obtained from the I-V relations in B, and superimposed fitted exponential curve. Resting [Cl–]i was obtained from a separate, preceding ramp (not shown). D, Voltage ramps (insets), leak and GABA-evoked currents used to probe [Cl–]i during recovery after the end of Cl– loading. Ramps for [Cl–]i estimates at two different times are shown in Da and Db (compare I-V relations in E). E, I-V relations from probe currents as in D (with the relations corresponding to currents in Da and Db indicated). Note that I-V relations are shifted with time to more negative voltages, as a consequence of the changing [Cl–]i and ECl. F, Full-time course of [Cl–]i changes during loading (first 25 s) and recovery phases with superimposed mono-exponential fit (red thick line) of the recovery phase.

