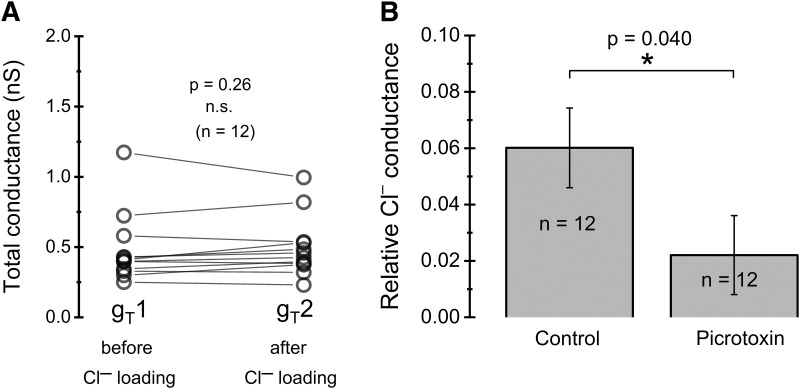
Figure 5.
Relative resting Cl– conductance. A, Distribution of measured total conductances (in the presence of VU0255011-1, TTX, Cd2+, and TEA; see main text), showing no significant difference before and after Cl– loading, as required for the method used to estimate resting Cl– conductance. Data paired for individual cells. B, Relative resting Cl– conductance, in control conditions and in the presence of 100 µM PTX. Note that the given values in B are relative to the total membrane conductance in the absence of blockers.

