
Figure 2. Iron concentrations in the inner and outer areas of the dAB and hAB, and their average values.
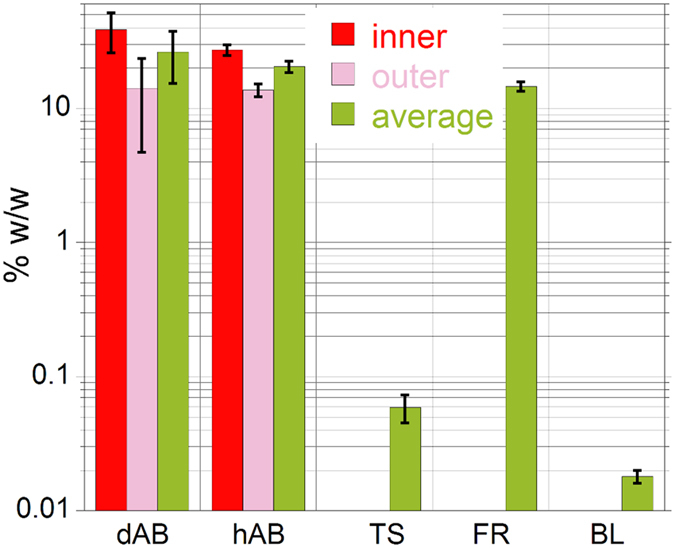
Also shown for comparison are the Fe concentrations in lung tissue areas without AB (TS), and in the ferritin and bovine liver references (FR and BL, respectively). The error bars represent the average of the standard deviations reported in Table 1. The y-axis is in logarithmic scale.