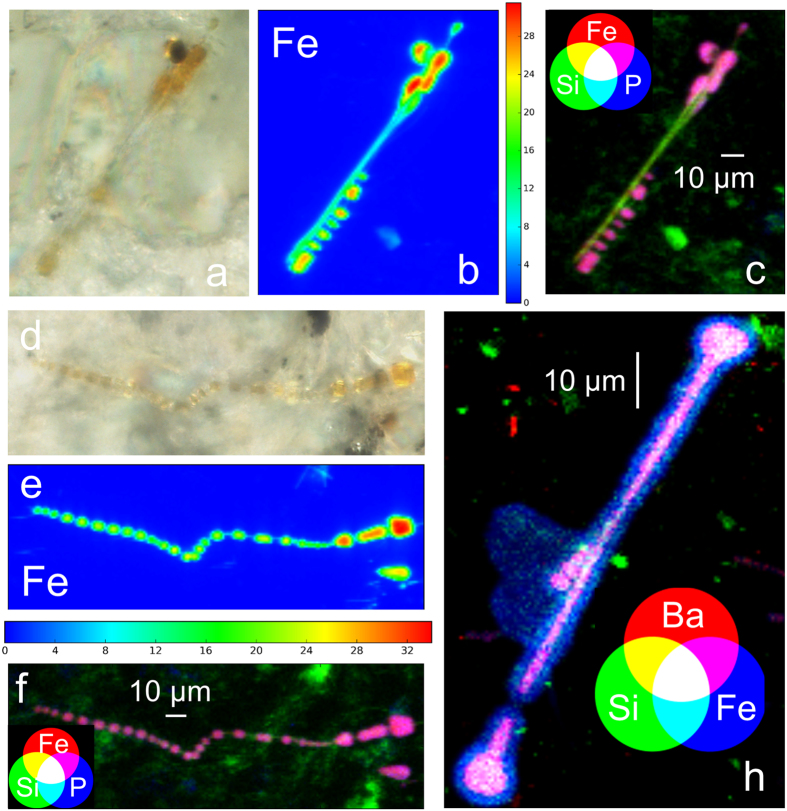
Figure 4.
(a,d) Optical microscope images (500x) of hAB from case A and case B, respectively. (b,e) Elemental distribution maps of Fe in a hAB from case A and case B, respectively; the color bars indicate the concentration of Fe in % w/w. (c,f) RGB color combination showing the distribution of Si, Fe, and P of hAB from case A and case B, respectively. (h) Distribution and co-localization of Si, Fe, and Ba in a dAB from case A. The distributions of the other elements detected are reported in Figures S6 and S9 in the SI. The XRF maps shown in the Figure were acquired in vacuum at 7.3 keV, with a pixel size of 0.5 × 0.5 μm2, and a dwell time of 0.2s.

