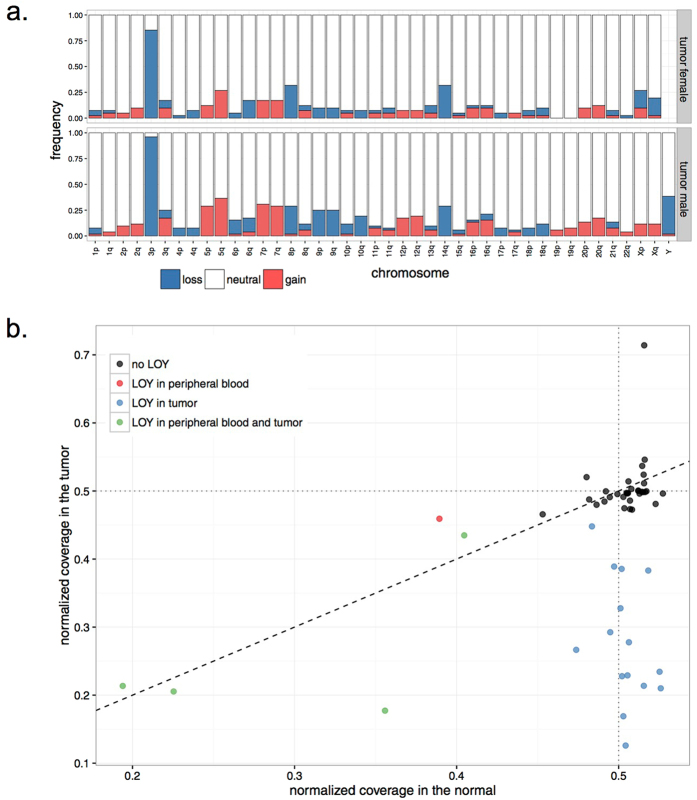
Figure 1. Copy number analysis in ccRCC.
(a) Bar graphs show the frequency of copy number variations across the genome in ccRCC tumors. Frequencies are presented in samples from female and male cases separately. (b) Status of chromosome Y in DNA isolated from tumors (Y-axis) and patient-matched peripheral blood (X-axis) is shown for individual male subjects. In samples affected by LOY, the normalized coverage of chromosome Y, shown on Y and X axes for tumor and normal samples, respectively, is lower than the expected value of 0.5. The color codes define patient groups with different states for LOY.

