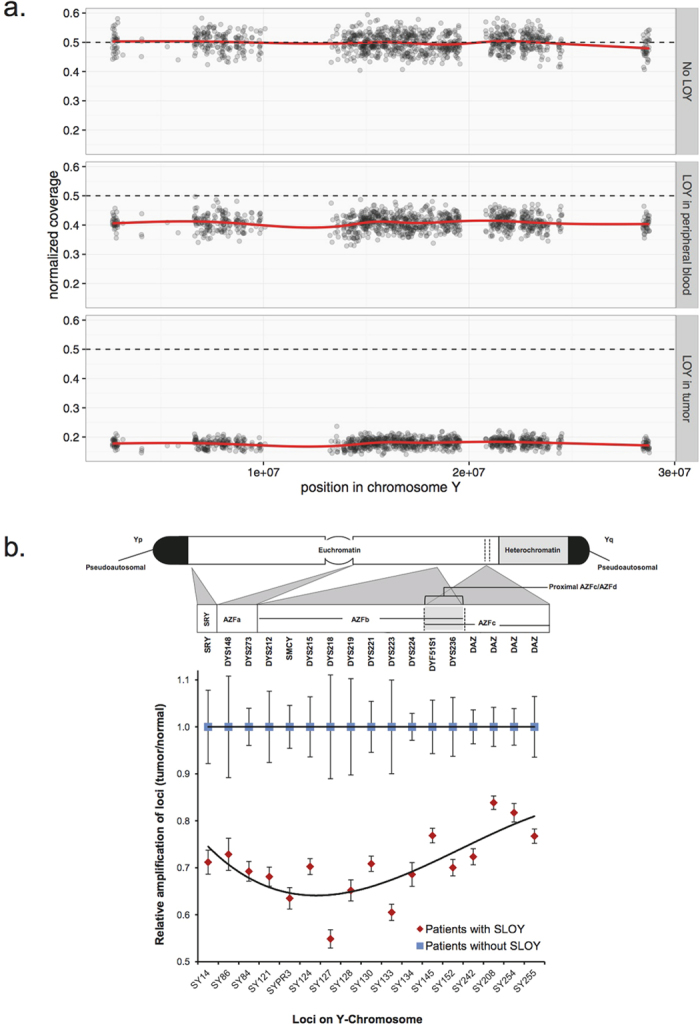
Figure 2. LOY affects whole chromosome.

(a) Sequencing coverage across chromosome Y is shown in constitutional DNA samples without (top) and with LOY (middle), and in a tumor sample with LOY (bottom). (b) The cartoon on top depicts the location of the loci examined by PCR on Y chromosome. The dot graph on bottom shows average of relative amplification values (Tumor/normal samples of the same patient) for each locus in patients with (red) and without (blue) somatic LOY (SLOY). Error bars show the range across patients of each group.
