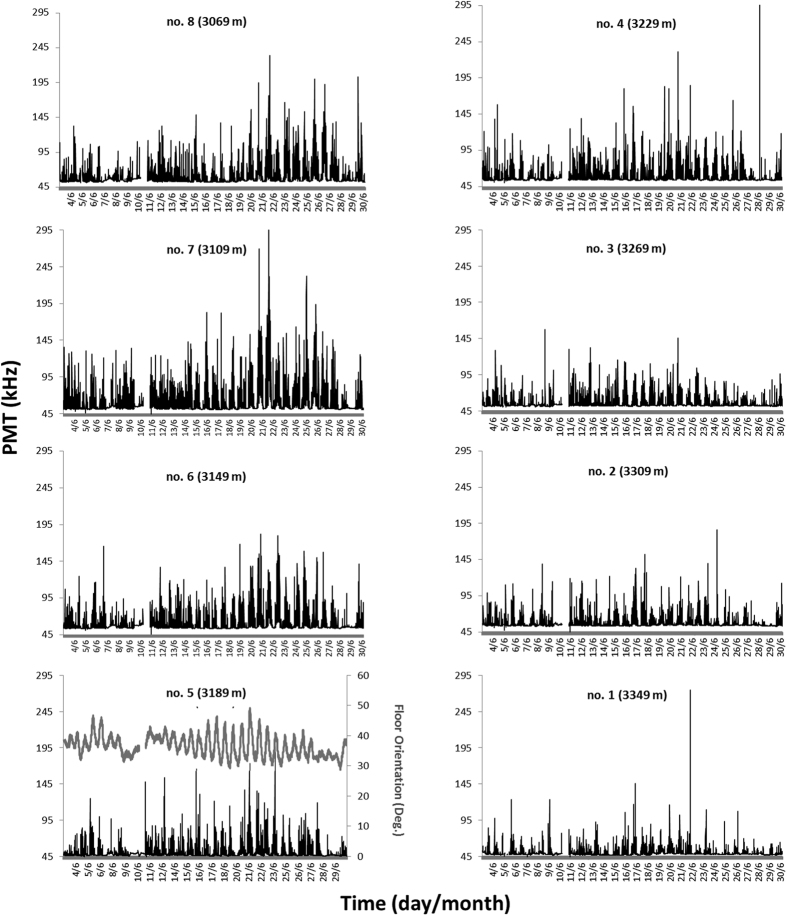
Figure 1. Time series of PMT readings for the 8 sampling floors of the telescope tower, as recorded during the entire testing period of June 2013.
Floor no. 5 has been plotted together with its displacement time series, to underline differences in amplitude between the 1st (3–16th of June) and the 2nd period (17–30th of June). It should be noticed that the light emitted by 40K decay is around 45–50 kHz, so bioluminescence readings are above that background threshold. Short period gaps in data sets are due to failure in data acquisition. Also, the presence of sparse outlier peaking values, sometimes several orders of magnitude larger than most other data points, should be noted.

