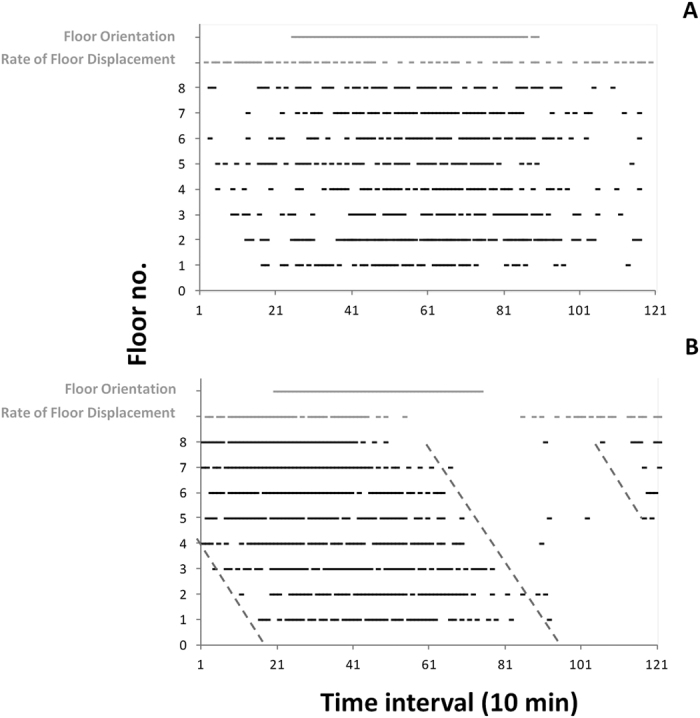
Figure 5. Phases’ relationship chart showing the amplitude of all waveform peaks for PMT (one per floor) and floor information (orientation and rate of displacement), as proxies of speed and angular direction, plotted together in relation to the inertial day-length (i.e. the time is in 10 min units, equivalent to time series sub-segments of 1230 min length).

Oblique dashed grey lines are the visual fitting connecting waveform peak onsets and offsets though the floors.
