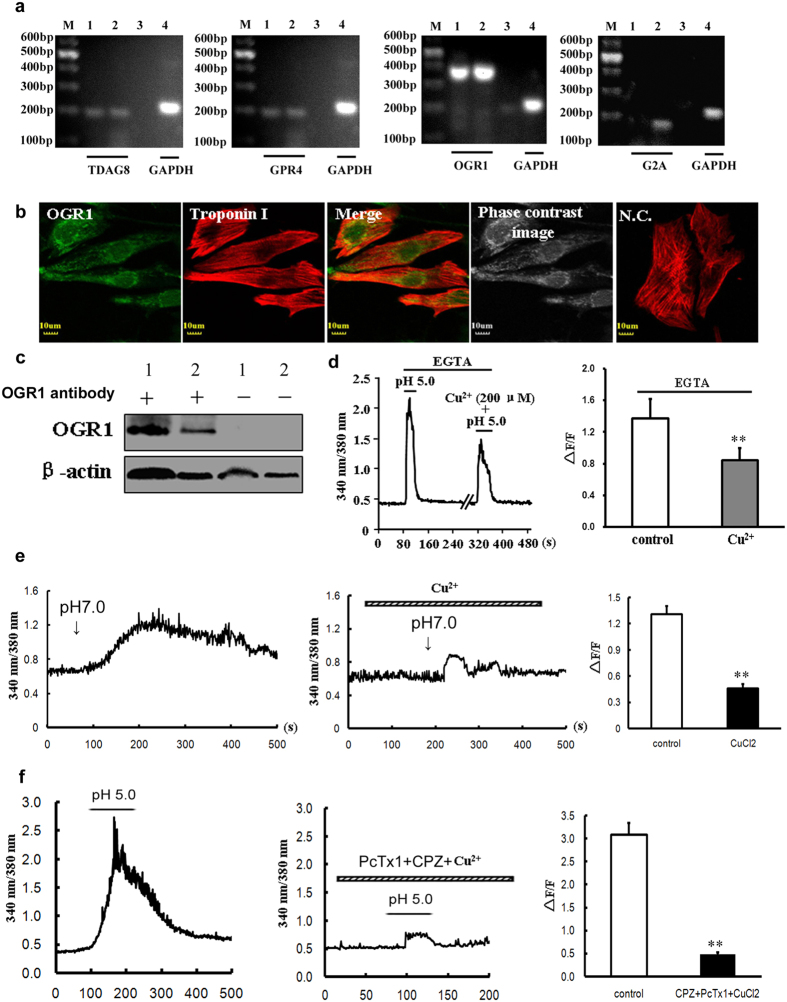
Figure 7. The involvement of OGR1 in the extracellular acidification-induced Ca2+ mobilization in rat ventricular cardiomyocytes.
(a) RT-PCR detection of TDAG8, GPR4, OGR1, and G2A mRNA transcription in cultured rat cardiomyocytes. Spleen tissues were used as positive controls, and samples without the addition of RNA were used as negative controls. M: marker; 1, 4: cardiomyocytes; 2: spleen; 3: negative sample. Representative data were shown from three independent experiments. (b) Co-localization of OGR1 (green) and Troponin I (red) in in vitro rat primary cardiomyocytes by double-labeling fluorescence. NC: without primary OGR1 antibody as negative control. Scale bars: 10 μm. Representative images were shown from three independent experiments. (c) Western blotting indicating the protein expression of OGR1 in rat cardiomyocytes. Spleen tissues were used as positive controls, and samples without OGR1 antibody were used as negative controls. 1: spleen; 2 cardiomyocytes. Representative blots were shown from four independent experiments. The blots with multiple exposure times were shown in Supplementary Fig. S3. (d) Representative 340/380 nm ratio and summary data (∆F/F) of primary cardiomyocytes showing the changes in [Ca2+]i induced by pH 5.0 solution in the absence or presence of Cu2+ (200 μM). (n = 16 cells for control groups; n = 15 cells for Cu2+-treated groups). Data were shown as mean ± s.e.m (**P < 0.01 vs control, Student’s t-test). (e) Representative [Ca2+]i responses and summary data (∆F/F) of primary cardiomyocytes showing the changes of [Ca2+]i induced by lowing pH from 7.6 to 7.0 in the absence or presence of Cu2+ (100 μM) (n = 15 cells for control groups; n = 9 cells for Cu2+-treated groups). Data were shown as mean ± s.e.m (**P < 0.01 vs control, Student’s t-test). (f) Representative [Ca2+]i responses and summary data (∆F/F) of primary cardiomyocytes showing the changes of [Ca2+]i induced by pH 5.0 solution in the absence or presence of 20 μM CPZ + 10 nM PcTx1 + 200 μM Cu2+ (n = 20 cells for control groups; n = 25 cells for CPZ/PcTx1/Cu2+-treated groups). Data were shown as mean ± s.e.m (**P < 0.01 vs control, Student’s t-test).

