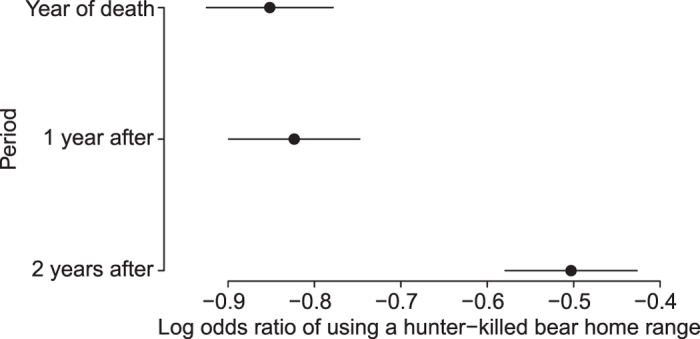
Figure 1. Changes in surviving male brown bears use of hunter-killed neighboring males’ home ranges over time.

Shown are the coefficients and 95% confidence intervals for three consecutive years, i.e. the year the hunter-killed male was shot (baseline) and the following two years.
