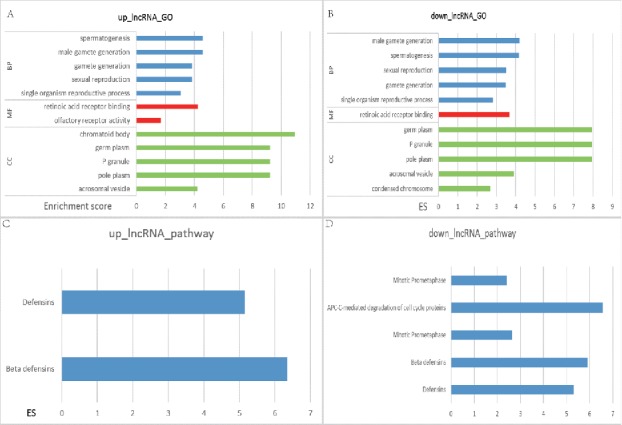
Figure 1.

The top 5 pathways of GO and KEGG enrichment analysis in differentially expressed IncRNA. The horizontal axis included the score of enrichment while the vertical axis represented the enriched pathways. GO annotation of upregulated IncRNA was displayed in (A) while the downregulated ones were in (B). (C) was the KEGG annotation of upregulated lncRNA while (D) was that of downregulated lncRNA. The higher the enrichment score was, the more the pathways were involved in cancer regulation.
