
Figure 3.
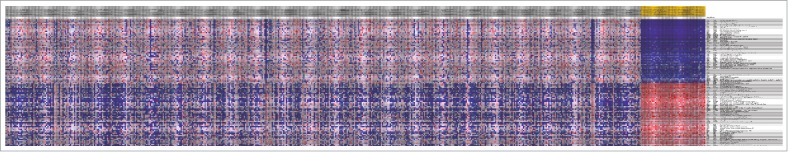
The top 100 differentially exprssed oncogenes between normal samples and tumor specimens. The horizontal axis was samples whie the gray ones were tumor samples and the yellow ones were normal specimens. The vertical axis stands for different genes.