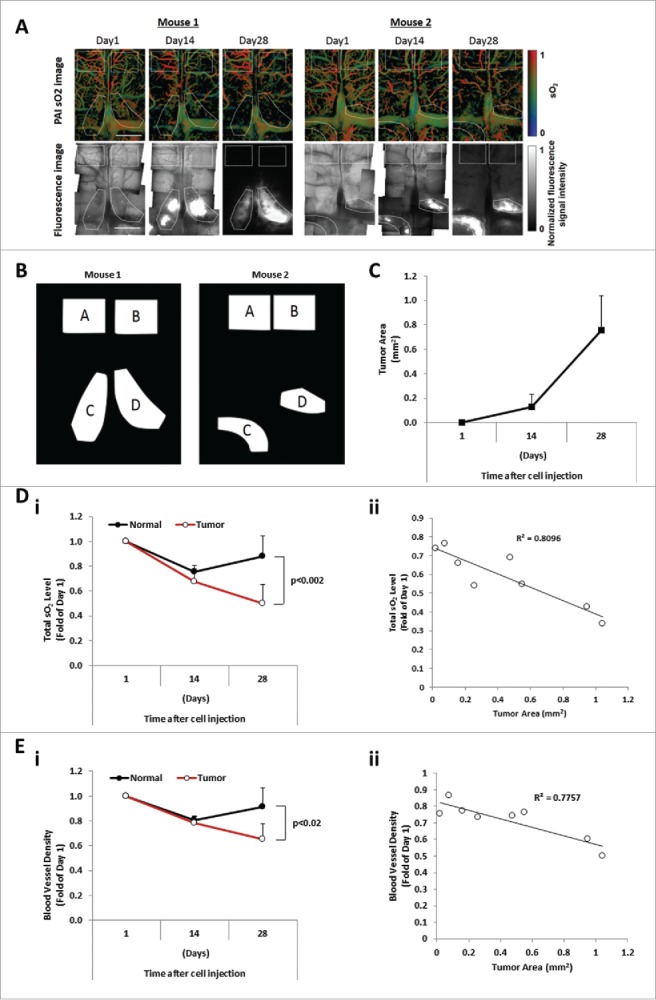
Figure 2.

The sO2 level and blood vessel density are inversely correlated with the tumor burden. (A) Images of sO2 levels acquired by OR-PAM and the corresponding fluorescence microscopy images. The mouse brain was imaged at Day 1, Day 14, and Day 28 after intravenous injection of MM cells. Scale bars: 1 mm. (B) Designated regions of interest (ROI) of mouse 1 and mouse 2 used for analysis denoted as normal areas, regions A and B, and tumor areas, regions C and D. (C) Tumor progression evaluated as the tumor area (mm2) measured at Days 1, 14, and 28 post MM cell injection (mean ± SD), n = 4. (Di) Comparison of average relative total sO2 level between tumor and normal regions over the course of 4 weeks and normalized to Day 1 post MM injection (mean ± SD), n = 4. (Dii) Correlation between the oxygenation (total sO2) and the tumor area (mm2) with correlation coefficient R2 = 0.8096. (Ei) Comparison of average blood vessel density between tumor and normal regions over the course of 4 weeks and normalized to Day 1 post MM injection (mean ± SD), n = 4. (Eii) Correlation between the blood vessel density and the tumor area (mm2) shows a correlation coefficient R2 = 0.7757.
