Fig. 1.

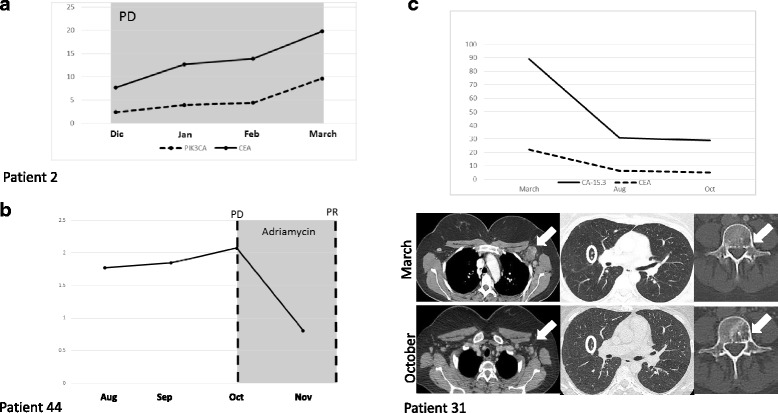
Panel (A) shows plasma levels of H1047R PIK3CA mutation (%) on cfDNA quantified by dPCR and CEA (ng/ml) tumor marker across four time points (months) (Pearson correlation coefficient =0.92) from patient 2, PD = progressive disease. Panel (B) shows plasma levels of H1047R PIK3CA mutation (%) on cfDNA across four time points (months). Disease status as ascertained on a CT-scan at two time points is marked with a discontinuous line. The use of adryamicine based chemotherapy is indicated by gray shading. As shown, PIK3CA mutation quantification increased until October when the patient 44 was diagnosed as having a progressive disease (PD). Subsequently, the patient received a different line of palliative treatment. PIK3CA mutation significantly decreased from 2.08% (CI 1.768% – 2.429%) to 0.81% (0.487% – 1.342%) correlating with the partial response (PR) assessed by CT-scan. Panel (C) shows the plasma levels of tumor markers 15–3 (U/ml) and CEA (ng/ml) and CT-scans showing the bone metastasis, lung metastases and the axillary adenopathy from patient 31. In this case the H1047R mutation quantification went down to 0% over the course of treatment (from 0.19 to 0%) correlating with tumor markers, the visceral metastases (white arrow) and the adenopathies (circle) although the bone metastasis increased significantly in size (white arrow)
