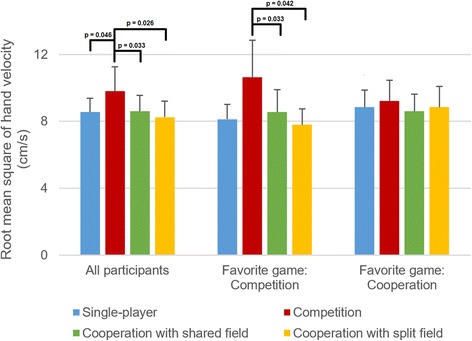
Fig. 8.

Root-mean-square values of hand velocity in different games for all impaired participants (N = 28), for participants whose favorite game was the competitive one (N = 12), and for participants whose favorite game was one of the two cooperative ones (N = 12). Presented as means and 95% confidence intervals
