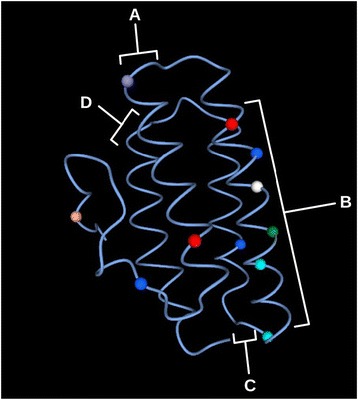
Fig. 3.

Hr showing differences in evolutionary rates between cHrs and myoHrs sequences calculated with DIVERGE [41] using a 0.7 cutoff. A and C α-helices presented one site each above the cutoff value, D α-helix did not present any sites, and B α-helix presented five sites. Colored dots represent sites above cutoff value, and different colors are only to aid illustration
