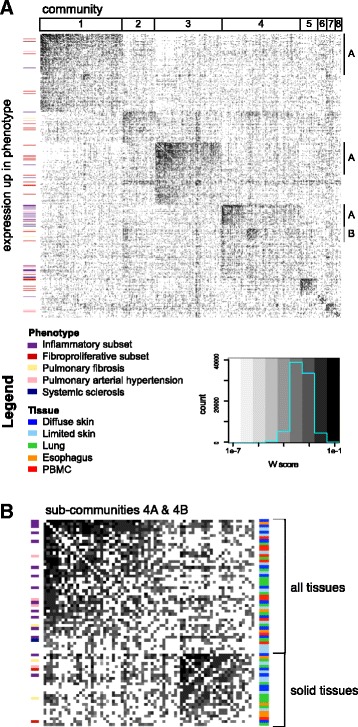
Fig. 2.

The multi-tissue module overlap graph demonstrates that severe pathophenotypes have similar underlying expression patterns. a The full adjacency matrix of the module overlap graph sorted to reveal hierarchical community structure. A darker cell color is indicative of a higher W score or larger edge weight. Communities (numbered) and sub-communities (lettered) are indicated by the annotation tracks above and on the right side of the matrix, respectively. Coexpression modules with expression that is increased in a phenotype of interest are marked by the annotation bar on the left side of the matrix. If a module was up in SSc as well as another pathophenotype of interest, the other pathophenotype color is displayed. b The adjacency matrix of sub-communities 4A and 4B indicates that these clusters contain modules that are up in all pathophenotypes of interest and show that there are many edges between the two sub-communities. Sub-community 4A contains modules from all tissues whereas 4B contains mostly solid tissue modules as indicated by the tissue annotation track to the left of the matrix
