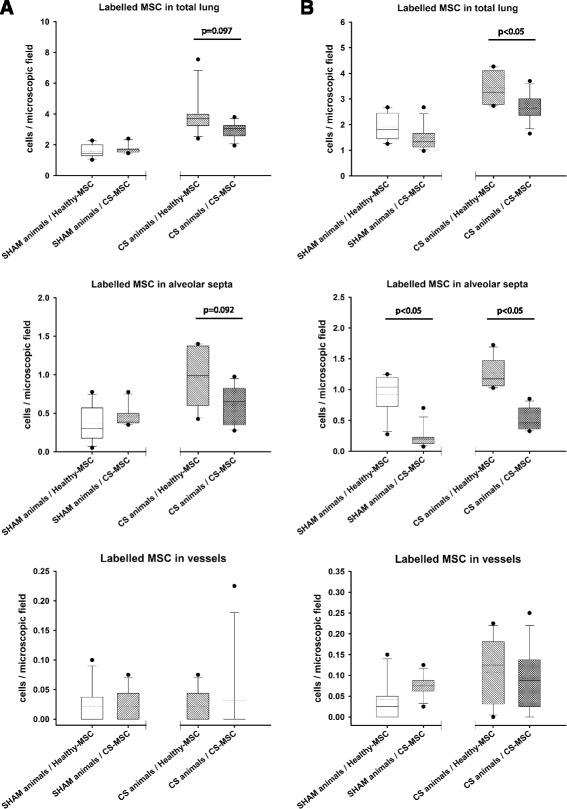
Fig. 4.

Box plots of infiltrated labelled cells in different lung structures. Cells were counted in total lung, alveolar septa and blood vessels after intratracheal (a) or vascular (b) administration of BM-MSC obtained from healthy or CS exposed animals, P values were obtained using the Mann–Whitney U-test
