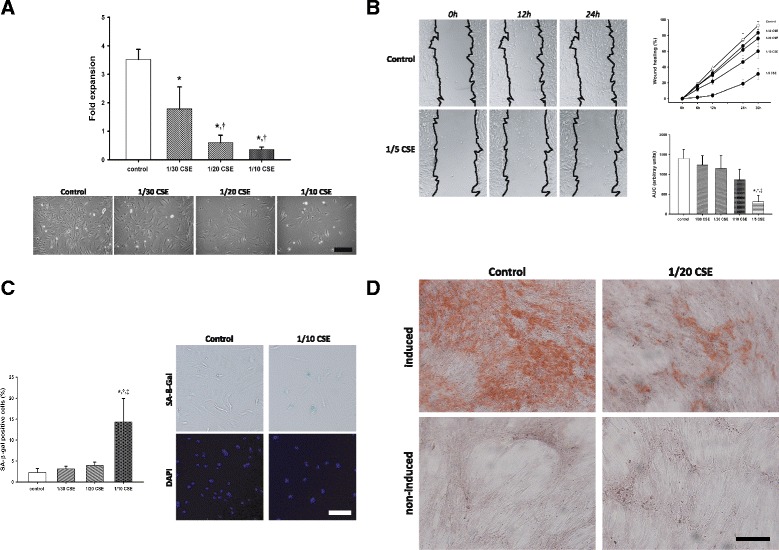
Fig. 6.

In vitro effects of CSE in cultured BM-MSC a BM-MSCs were incubated with increasing concentrations of CSE for 4 days. Bar graph shows the fold expansion of the cells in different conditions. In the lower panel are representative photomicrographs of the different conditions. Scale bar: 250 μm. b Wound healing assay: BM-MSCs were incubated with increasing concentrations of CSE after a scratch was performed in the confluent monolayer. Pictures were taken after 0, 6, 12, 24 and 30 h. The line graph shows wound closure kinetics and the bar graph shows the area under the curve (AUC) of the time curves under different conditions. c Cellular senescence assay in BM-MSCs after 24 h of stimulation with different concentrations of CSE. The bar graph shows the relative gene expression of SA-β-Gal expression. Scale bar: 150 μm. d Differentiation of BM-MSCs in presence or absence of CSE: Cells were incubated for 3 weeks in either induction or normal growth medium in the presence or absence of 5% CSE. Alizarin red stain. Scale bar 250 μm. P value was assessed by one-way ANOVA and post-hoc Holm-Sidak method. * p < 0.05 vs control; † p < 0.05 vs 1/30; ‡ p < 0.05 vs 1/20
