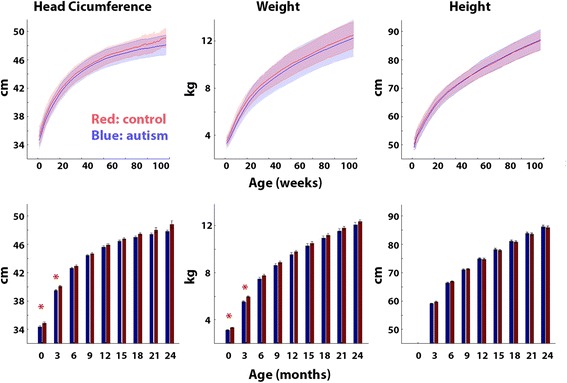
Fig. 2.

Comparison of HC, weight, and height across autism (blue) and control (red) groups. Top row: Mean of each group as a function of age in weeks. Shaded area: standard deviation across toddlers. Bottom row: Mean of each group in 3-month periods. Error bars: standard error of the mean across subjects. Red asterisks: significantly larger values in the control group (p < 0.05, uncorrected to increase sensitivity)
