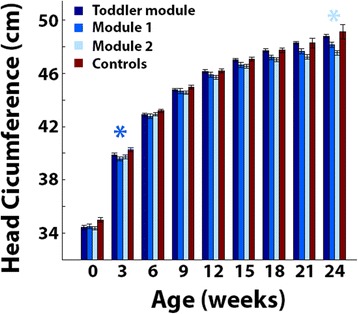
Fig. 5.

Comparison of HC at specific ages when separating the autism group according to ADOS modules. Mean HC in toddlers with autism diagnosed with the toddler module (dark blue), module 1 (medium blue), or module 2 (light blue), and control toddlers (red). Error bars: standard error of the mean across toddlers in each group. Asterisks: significantly larger HC in the control group as compared with that in the autism group of the corresponding color (p < 0.05, uncorrected to increase sensitivity)
