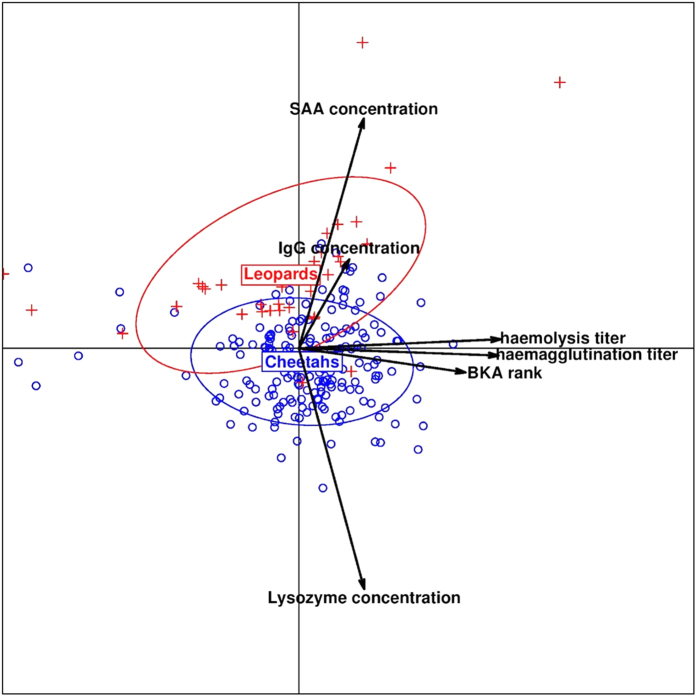
Figure 1. Immune differences between cheetahs and leopards.
Position of all cheetahs (small circles) and leopards (plus signs) projected into the space defined by the first two principal components (PC1 in x-axis and PC2 in y-axis) of a principal component analysis performed on all six immune parameters. Together PC1 and PC2 capture nearly 64% of the total variance. Arrows represent the contribution of each immune parameter to PC1 and PC2. For each species, 1.5 inertia ellipses are depicted.

