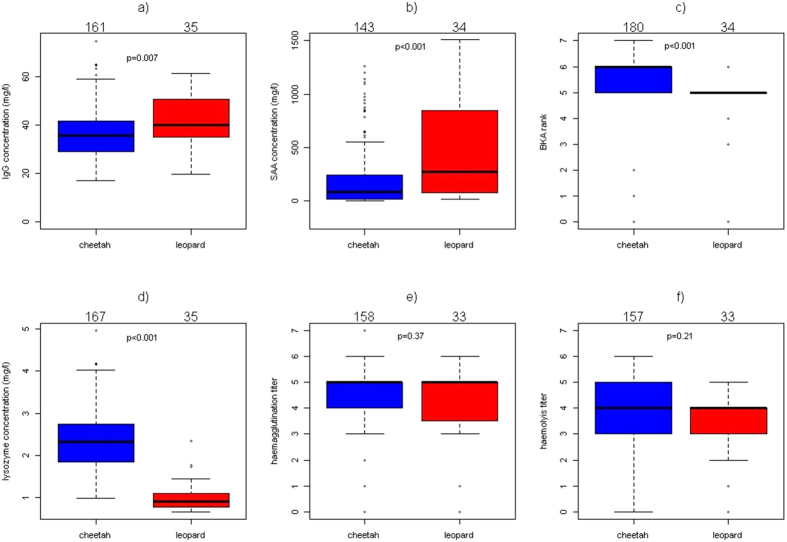
Figure 2. Pairwise comparison of immune parameters of cheetahs with leopards.
(a) Immunoglobulin G concentration (b) Serum amyloid A (SAA) concentration (c) Bacterial killing assay (BKA) ranks (d) Lysozyme concentration, (e) Haemagglutination titer (f) Haemolysis titer. (a) is part of the adaptive immunity, (b) of the induced innate immunity and (c–f) are part of the constitutive innate immunity. Boxplots depict medians with 25% and 75% quartiles, P-values are indicated above the bars and samples sizes above the graphs.

