
Figure 2. Human B-1 cells arising in the NSG model display a mature phenotype, according to CD38 versus CD24 expression pattern, and are widely distributed in tissues of HIS mice.
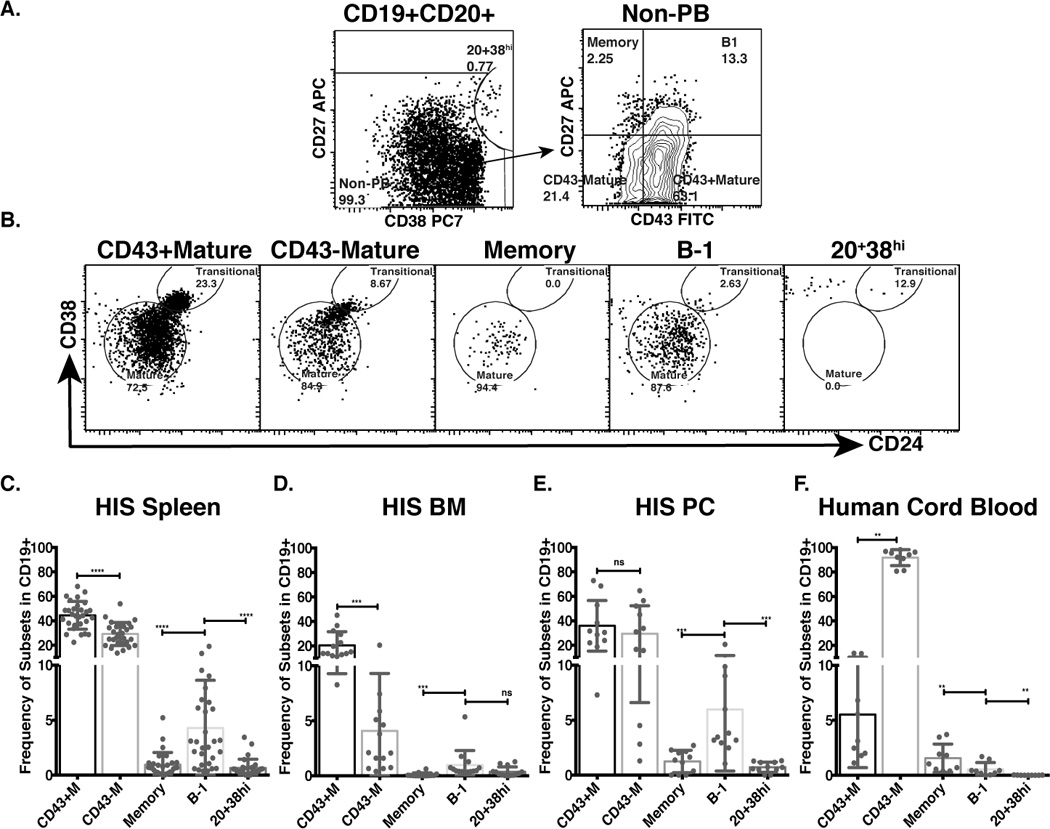
Splenic, bone marrow, and peritoneal cavity cells from HIS mice 10–17 weeks after transplant with cord blood Lin−CD34+CD38lo cells were isolated and stained for human B cell surface makers. A. Dot plots show expression of CD38 and CD27 by live CD3/4/7−CD19+CD20+ gated splenic B cells from HIS mice (left panel) separating pre-plasmablasts (CD20+CD38hi cells) from other B cells (non-PB), and CD43 and CD27 expression (right panel) by non-PB separating B-1 cells from other B-2 cells (Memory, CD43− mature, and CD43+ mature B cells). B. Dot plots show expression of CD24 and CD38 on selected B cell subsets. C–E. Bar graphs show frequency of selected subsets in HIS spleen (C), bone marrow (HIS BM) (D) and peritoneal cavity (HIS PC) (E). F. Bar graph shows the frequencies of selected B cell subsets in human cord blood mononuclear cells. (nsp>0.05, *p≤0.05, **p≤0.01 ***p≤0.001, ****p≤0.0001, Wilcoxon matched-pairs signed rank test).