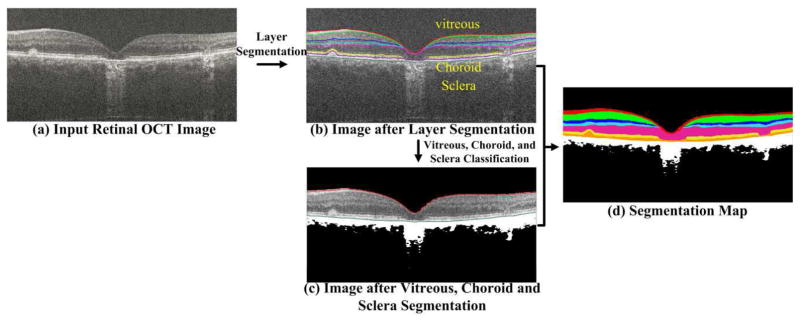
Fig. 2.
Outline for the OCT segmentation. In (b), the retinal OCT image is segmented into seven layers using eight color lines, and the region between two color lines represents one layer. Three distinct regions, above and below the retina include vitreous, visible choroid, and sclera. In (c), the vitreous and choroid/sclera regions are further classified into two clusters (one is the black area and one is the white area). In (d), different color regions represent varied segmented layers or classified regions. The dimly visible regions of choroid can be regarded as the background area (delineated in black) with less structural information. The visible regions of choroid can be considered as the foreground area with comparatively rich structural information, delineated in white. Therefore, we set the clustering number K of the X-means algorithm to 2, which further clusters the vitreous, choroid, and sclera regions into two groups, i.e. the black and white areas in (c) and (d).

