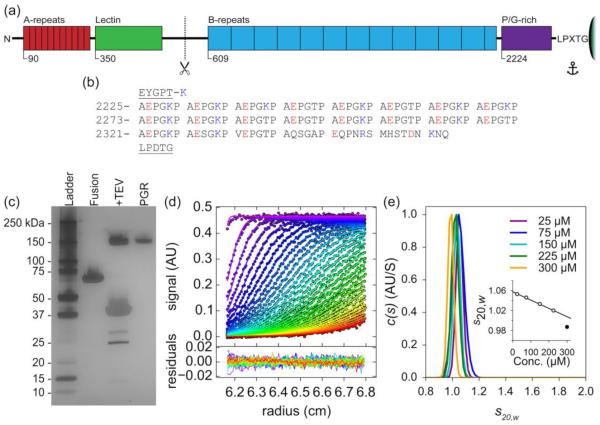
Figure 1. PGR shows aberrant mobility and exists as an elongated monomer in solution.
(a) Schematic of Aap anchored to the peptidoglycan layer of the S. epidermidis cell wall by the LPXTG Sortase A motif, with approximate domain boundaries shown for relative scale. (b) Amino acid sequence of PGR flanked by the end of the B-repeat superdomain (EYGPT) and the LPXTG motif (underlined) – note the repeating AEPGKP hextads. The amino acids are numbered as they appear in Aap from S. epidermidis RP62A. Positively charged residues in the PGR are colored blue, while negatively charged residues are colored red. Panel (c) shows the aberrant mobility of PGR by silver-stained SDS-PAGE. Fusion refers to the His-MBP-PGR fusion protein. +TEV is 6hr after the addition of TEV protease to cleave the His-MBP tag from PGR. PGR is post-ANX purification. While the His-MBP-PGR fusion protein migrates as expected, cleaved PGR (13.2 kDa) migrates more than 10 times more slowly than expected. (d) Sedimentation velocity AUC absorbance data (markers) and best-fit model (lines) in the upper panel. Residual error in the bottom panel, showing good fits to the data. Panel (e) shows the c(s) distribution analysis of PGR at multiple concentrations (75 μM = 1 mg/ml) indicating PGR does not self-assemble. The frictional ratio ranged from 2.1 to 2.3, indicating a highly elongated species. The calculated molecular weight was near that of monomeric PGR, suggesting PGR exists as a highly elongated monomer under native conditions across the concentration range tested. Standardized sedimentation coefficients (s20,w) are displayed representing s at 20° C and in water. A linear regression was performed to determine the standardized sedimentation coefficient at infinite dilution (s020,w) by extrapolation of s20,w to zero concentration ((e), inset), yielding a value of 1.06 S. The values used in the extrapolation are shown in white circles, while the 300 μM (4 mg/ml) value shown as a filled circle was omitted. Detailed results can be found in Table S1.

