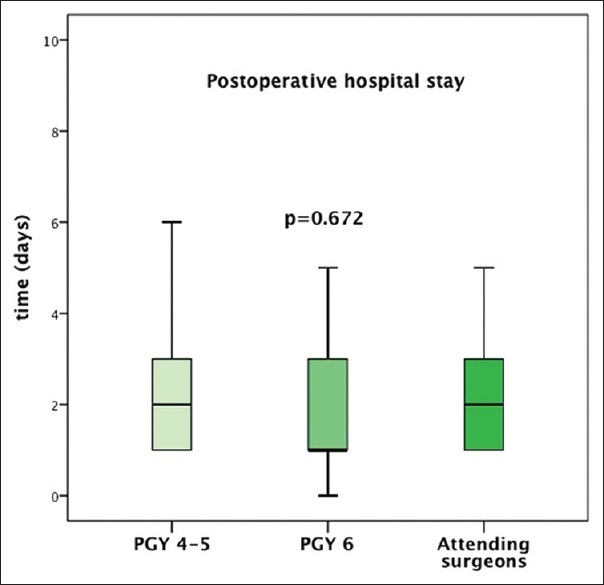
Figure 1.

Distribution of post-operative hospital stay according to study groups: Group of post-graduate 4–5, post-graduate 6 and attending surgeons. The boxes are defined by the 25th and 75th percentiles. The lines inside the boxes represent the median times. The error bars represent the largest values not more than 1.5 times the length of the box from the quartiles
