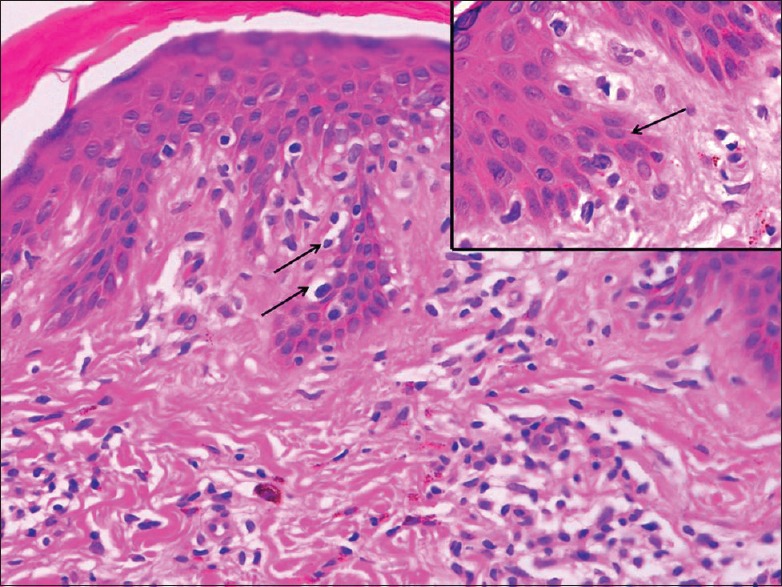
Figure 2.

Thinned out epidermis with single cell infiltration in the basal layer. The lymphoid cells appear enlarged and surrounded by clear halo (arrow). Papillary dermis shows increased fibrosis (H and E, ×100). Higher power view of epidermis in inset showing infiltrating atypical hyperchromatic lymphoid cells (H and E, ×1000)
