
Figure 2.
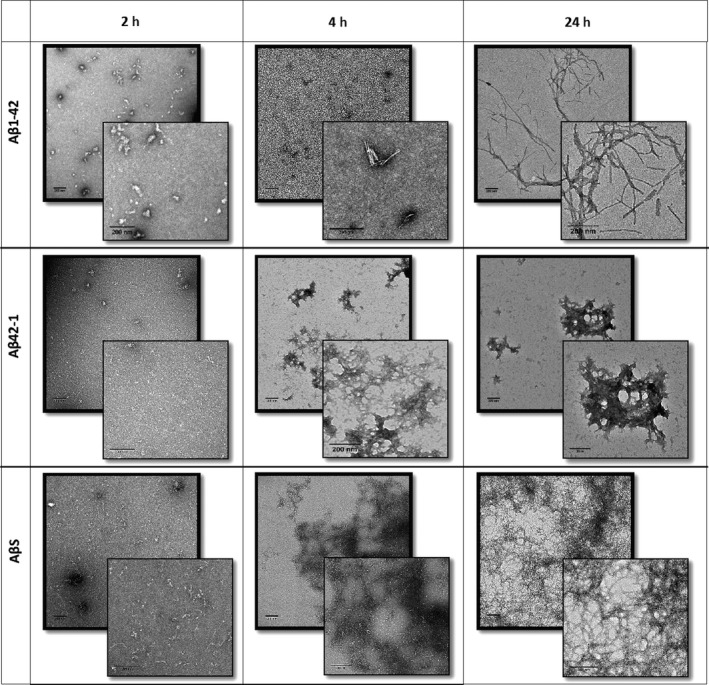
Negative stain transmission electron micrographs with magnified images. Aβ1‐42 (top row), Aβ42‐1 (middle row) and AβS (bottom row) at 2, 4 and 24 h show Aβ1‐42 assembly from small spherical oligomers to long fibrils by 24 h. Aβ42‐1 shows slightly larger spherical species at 2 h which form clumps of fibrils by 4 h. AβS shows small fibrils by 2 h and fibrillar networks by 4 h which are larger by 24 h. Scale bars 200 nm.