
Figure 1.
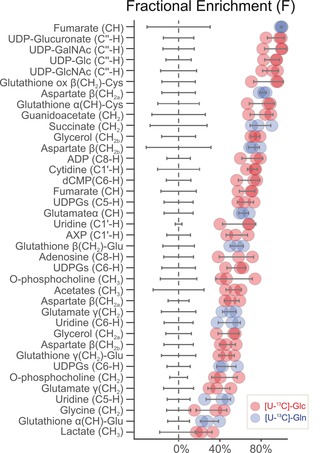
PEPA predicted significant fractional enrichments (F) calculated following Equation (2). Red and blue dots represent individual F values calculated for each of the three replicate samples using [U‐13C‐Glc] or [U‐13C Gln], respectively. Gray lines indicate F standard deviation.