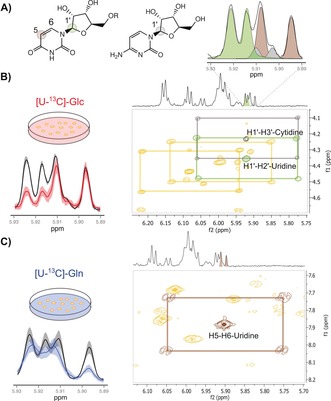
Figure 2.

Validation of PEPA using TOCSY (A) 1D‐1H‐NMR spectral region at δ[5.89–5.93 ppm] shows the deconvolution of overlapping proton resonances in C1′‐H position of uridine (d,J=4.4 Hz, green) and cytidine (d,J=4.1 Hz, gray), and C5‐H position of uracil in the uridine structure (d,J=8.5 Hz, brown). B) Left panel: mean area (solid line) and standard deviation (color‐shaded) of 1D‐1H‐NMR spectra acquired on unlabeled (black) and [U‐13C]‐Glc (red) cell extracts showing a significant decayed area of C1′‐H uridine and cytidine doublets. Right panel: TOCSY spectrum shows 13C cross‐peaks traced around their corresponding central unlabeled signals in green (H1′–H2′ correlation of uridine) and gray (H1′–H3′ correlation of cytidine). Additional 13C cross‐peaks for H1′–H3′ correlation of adenosine and H1′–H2′ of UDPG‐derived compounds are also indicated. C) Left panel: mean area (solid line) and standard deviation (color‐shaded) of 1D‐1H‐NMR spectra acquired on unlabeled (black) and [U‐13C]‐Gln (blue) cell extracts showing a significant decayed area for C5‐H position of uracil in the uridine structure. Right panel: TOCSY spectrum shows 13C cross‐peaks traced around the corresponding central unlabeled signal in brown (H5–H6 correlation of uridine).
