Scheme 1.

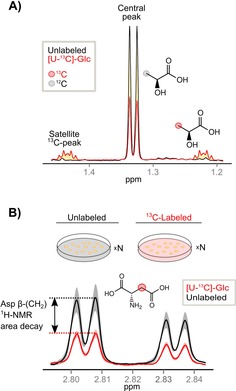
A) PEPA's conceptual framework: 1D‐1H‐NMR spectral resonance of methyl protons in lactate at δ(1.33 ppm) obtained from cell extracts of two identical U2OS osteosarcoma cell cultures grown in either unlabeled glucose (black solid line) or [U‐13C]‐glucose (Glc) (red solid line). The latter shows evenly spaced 13C‐satellite peaks located at ±1 J(C–H)/2 from the central peak. These 13C‐satellite peaks result from heteronuclear (13C–1H) scalar couplings due to the replacement of 12C‐atoms in the methyl group of lactate by 13C‐atoms from [U‐13C]‐Glc. The area of 13C‐satellite peaks (yellow‐shaded) indicates the amount of 13C‐labeled methyl group in lactate while the area of the central peak (red line) represents the amount of unlabeled methyl group left. As the labeled substrate [U‐13C]‐Glc is metabolized into lactate, the area of 13C‐satellite peaks increases proportionally with the decay of the central peak (red line). The decayed area of this central peak can be quantified from the total pool of lactate in unlabeled equivalent samples (black line). B) PEPA's workflow: metabolites are extracted from replicates (n≥3) of unlabeled and 13C‐labeled (e.g., [U‐13C]‐Glc) biologically equivalent samples and these measured by 1D‐1H‐NMR. Next, 1D‐1H‐NMR spectra are profiled and resonances quantified. Significant decayed areas of central peaks in [U‐13C]‐Glc spectra by comparison with non‐labeled controls are determined via statistical testing. As an example, aspartate β(CH2) resonance at 2.82 ppm in three replicates of unlabeled (black) and labeled (red) samples provides the mean value of the area (solid line) and standard deviations (color shaded). Significant central peak decay proves 13C‐enrichment in this position indicating metabolic transformation of glucose into aspartate in U2OS osteosarcoma cell lines.
