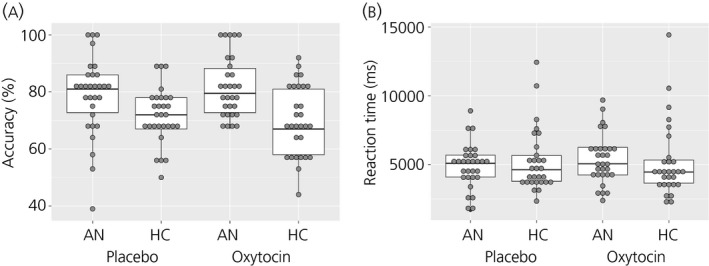
Figure 1.

Percentage accuracy (a) and reaction times (b) on the Reading the Mind in the Eyes (RMET) in the anorexia nervosa (AN) and healthy comparison (HC) groups in the oxytocin and placebo conditions. Grey dots represent individual data points; the box plot represents the median, interquartile range, and the maximum and minimum of the data. RT, reaction time; ms, milliseconds.
