
Figure 4.
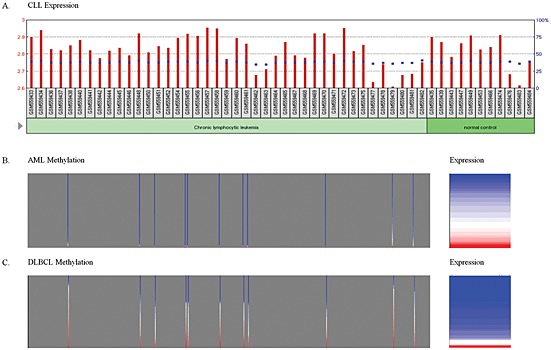
Methylation and expression of RUNDC3B in patient samples. The results shown here are based upon data generated by the TCGA Research Network: http://cancergenome.nih.gov/. (A) Expression of RUNDC3B in 41 chronic lymphocytic leukaemia (CLL) patients and 11 normal controls. The red bars and the left axis represent normalized counts. The blue squares and the right axis represent the percentile rank within the sample. (B) Methylation and expression in acute myeloid leukaemia (AML) patients. Methylation shown in grey box (left panel) for 11 cytosines (vertical bars) present in the RUNDC3B CGI. Proportional expression is shown in the right panel. (C) Methylation and expression in diffuse large B‐cell lymphoma (DLBCL) patients. Proportional methylation shown in grey box (left panel) for 11 cytosines (vertical bars) present in the RUNDC3B CGI. Proportional expression is shown in the right panel. Blue to red scale represents lowest to highest methylation and expression values