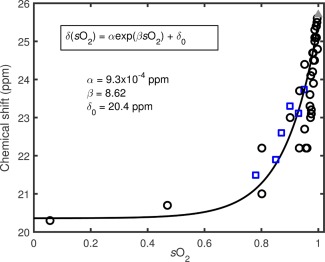
Figure 3.

The 129Xe‐RBC chemical shift plotted against the measured blood oxygen saturation, sO2, with the 129Xe‐plasma peak as a 0 ppm reference peak. Data from the two field strengths are denoted by black open circles (1.5 T) and blue open squares (3 T). The black line is a fit to both the 1.5 T and 3 T data using Equation (2). The grey triangle represents blood equilibrated with carbon monoxide (simulating the fully oxygenated conformation of hemoglobin).
