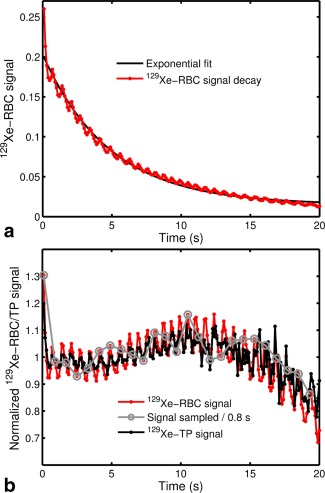
Figure 9.

a: In vivo 129Xe‐RBC signal in the lungs as a function of breathhold time for a TR of 100 ms, fitted with an exponential function. b: In vivo 129Xe‐RBC and 129Xe‐TP signal changes normalized to the fitted exponential in (a). The gray line illustrates the effect of sampling the observed 129Xe‐RBC and 129Xe‐TP signal oscillations at a rate of 800 ms−1.
