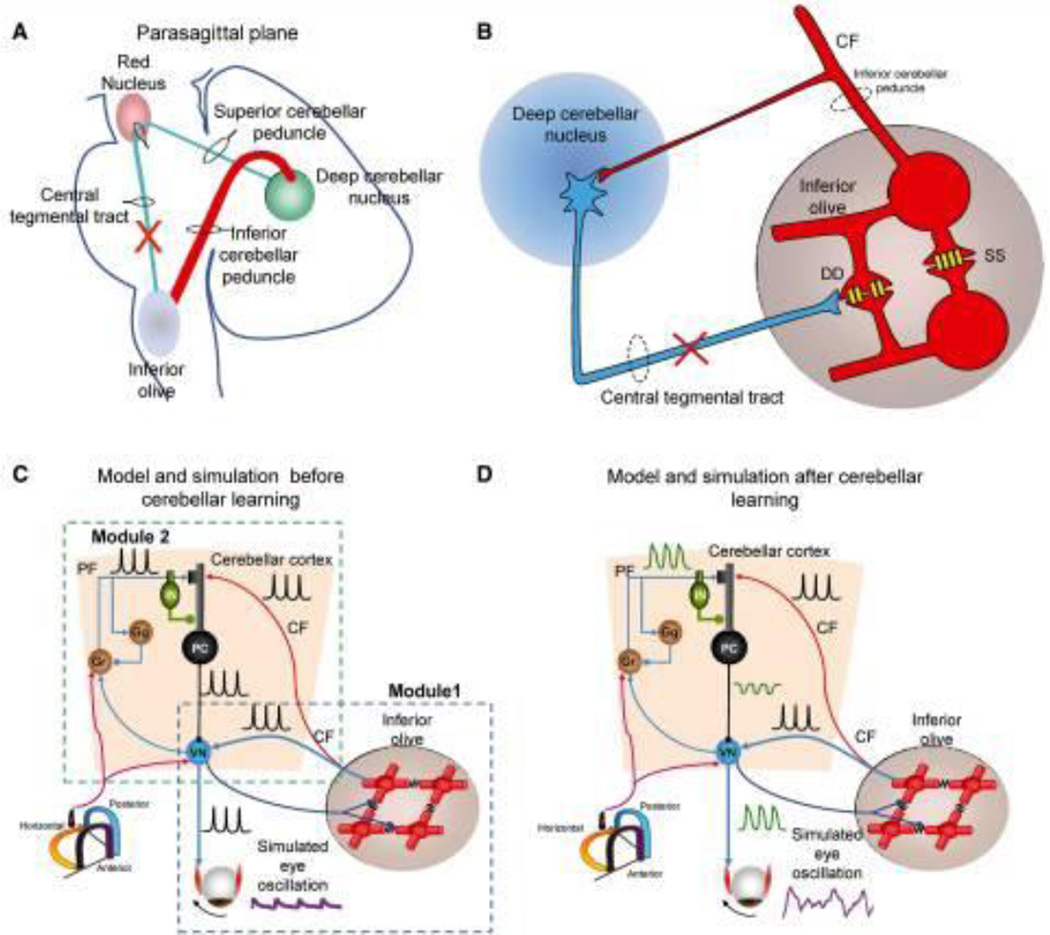
Figure 4.
Schematic representation of the Guillain–Mollaret triangle that is comprised of fibers connecting the deep cerebellar nuclei and contralateral inferior olive. These fibers pass near the red nucleus without any rubral relay (A). The coupling strength through the connexn gap junctions (schematized with yellow channels; DD) between neghboring inferior olivary neurons are inhibited by projections from the deep cerebellar nuclei (blue projection) (B). Lesions in the Guillain–Mollaret triangle (red X in A and B) leads to hypertrophy of the inferior olive and subsequently increased soma-somatic gap junction. Schematic representation of a “dual-mechanism model” (C and D). Model and traces from simulations after inferior olive hypertrophy but before maladaptive cerebellar modulation (C). Inferior olive and cerebellar modules after hypertrophy and maladaptation of the cerebellum module (D). Lower left corner shows icon for semicircular canals (C and D). Simulated membrane potentials (black), eye oscillations (magenta). CF = climbing fibres; PF = parallel fibres; DD = dendro-dendritic gap junction; SS = soma-somatic gap junction; Gr = granule cell layer; IN = interneurons; PC = Purkinje neurons.

