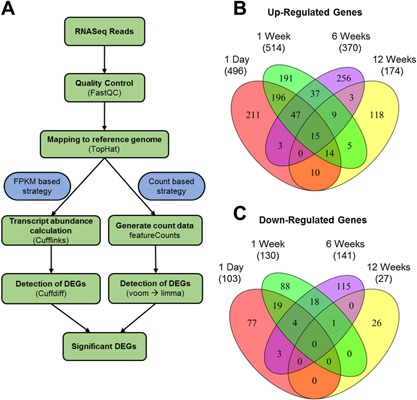
Figure 2.

RNA sequencing analysis methodology and differentially expressed transcripts. (A) Flowchart of RNAseq data analysis. All of the differentially regulated genes presented were identified by both the FPKM based method and the count based method as significantly differentially expressed (p < 0.05). Common differentially up (B) and down (C) regulated genes between every time point post TC injury. The total number of genes per category is in brackets beneath each time point.
