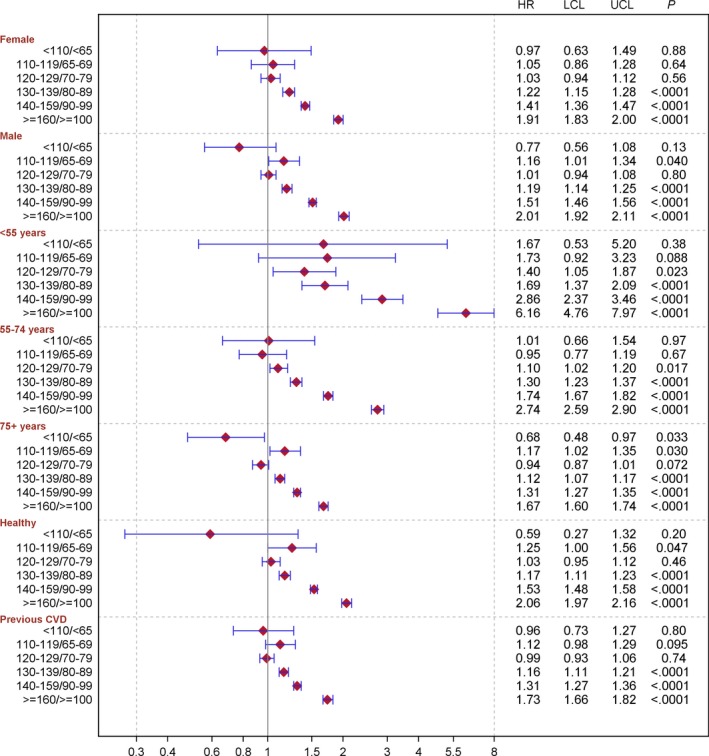
Figure 2.

Adjusted hazard ratios (HRs) for stroke in people with Type 2 diabetes compared with people without diabetes. HRs and 95% CIs were estimated by means of Cox regression. Subgroup analyses by sex were adjusted for time‐updated age, stratified by diabetes duration, being born in Sweden, maximum education level and baseline comorbidities (atrial fibrillation, coronary heart disease and heart failure). Subgroup analyses by age group were adjusted for sex, stratified by diabetes duration, being born in Sweden, maximum education level and baseline comorbidities (atrial fibrillation, coronary heart disease and heart failure). Subgroup analyses by previous cardiovascular disease (CVD; ICD‐10 I00‐99) were adjusted for sex, time‐updated age, stratified by diabetes duration, being born in Sweden, and maximum education level. LCL, lower confidence limit; UCL, upper confidence limit.
