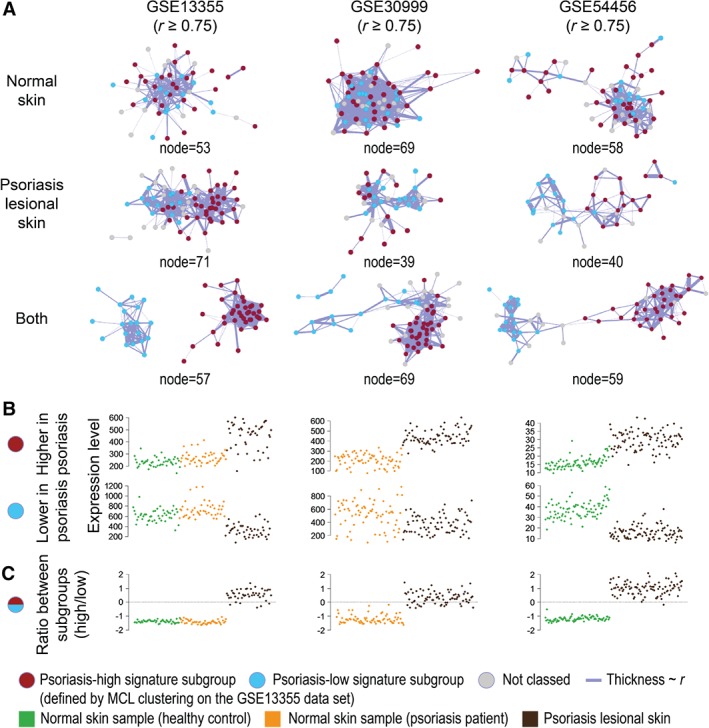
Figure 5.

Alteration in the keratinocyte differentiation signature in psoriasis. Co‐expression networks were constructed using only genes in the keratinocyte differentiation signature for psoriasis studies, GSE13355 (left), GSE30999 (middle), and GSE54456 (right). (A) Using the MCL algorithm on the network graph for the full dataset of GSE13355, the signature was split into two subgroups, one up‐regulated (red) and one down‐regulated (blue) in psoriasis. This clustering has been overlaid on the networks derived from the other studies. The separation of the keratinocyte differentiation signature subgroups is dependent on the sample types included in the network analysis: normal skin only (top), psoriatic lesions only (middle), and both sample types (bottom). (B) The average expression for all genes within each subgroup for each sample. (C) The log2 ratios between the expression of the two subgroups are generally lower than zero in the control samples. On the other hand, these ratios are higher and more variable in between psoriatic samples, perhaps reflecting disease severity.
