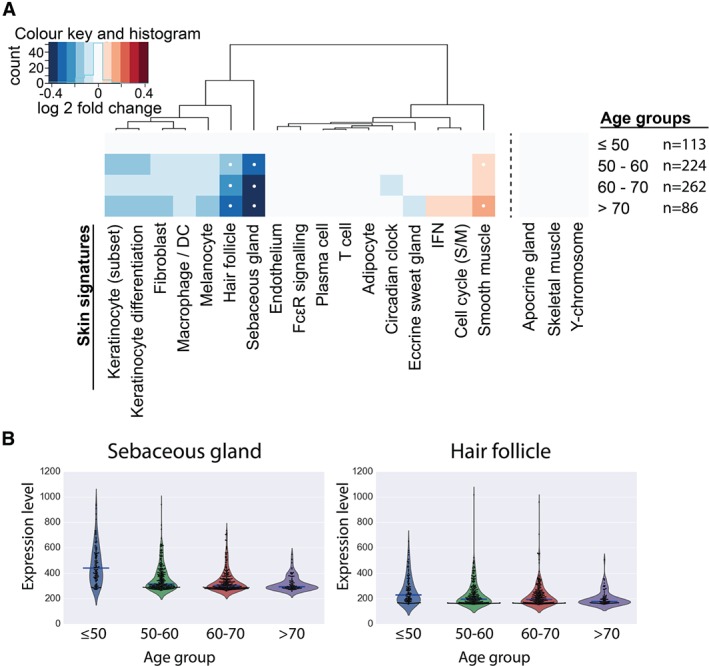
Figure 6.

Effects of ageing on SkinSig. (A) The heatmap illustrates the changes in SkinSig during ageing by comparing each age group with the youngest age group (≤50 years old), with comparisons yielding statistical significance (FDR ≤ 0.01 and ≥ 80% genes altered in the same direction) highlighted with a white dot. The fold change was calculated from the log2 mean expression for genes present in each signature. Rotation gene set tests were employed for statistical analysis. (B) The violin plots show the average expression for the hair follicle and sebaceous gland signatures for each individual. These plots show the change in distribution across age groups. The median expression value for each age group is indicated by a blue bar.
