Figure 3.

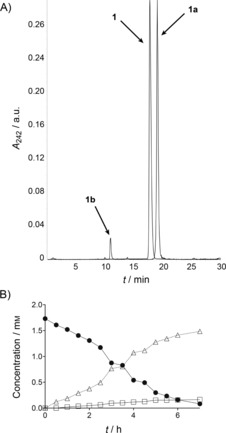
A) HPLC chromatogram and B) time‐course of CglUPO‐catalyzed conversion of testosterone (1). Overlaid LC‐MS elution profiles were recorded at 247 nm for •: testosterone; single ion t [M+H]+ 305 for the products (▵: 1 a, □: 1 b). B displays the reaction progress of the 100 mg approach.
