
Figure 1.
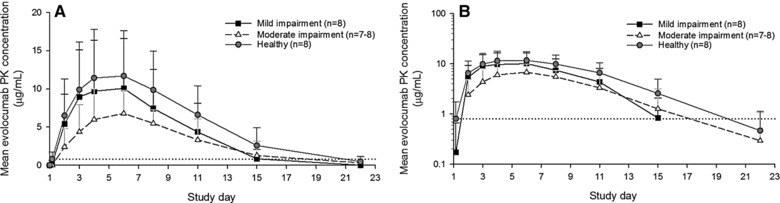
Mean (standard deviation) serum unbound evolocumab concentration‐time profiles from healthy individuals and those with hepatic impairment after a single 140‐mg subcutaneous evolocumab dose, shown as linear‐linear (A) and as log‐linear (B) plots. The horizontal dashed line represents the detection limit for unbound evolocumab (0.8 μg/mL). PK, pharmacokinetic.