
Figure 2.
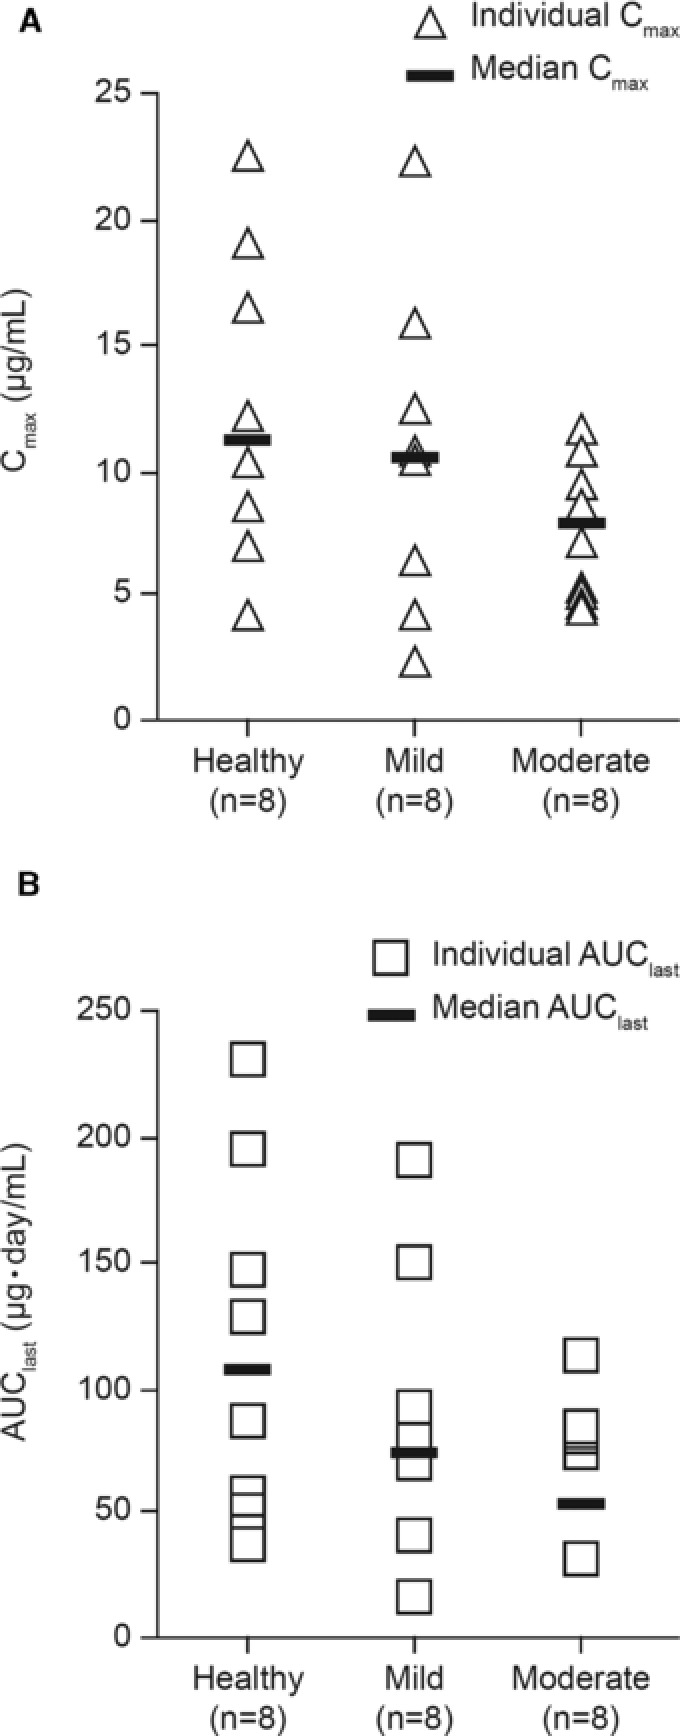
Scatter plots of individual and median values for (A) maximum unbound serum evolocumab concentration (Cmax) and (B) area under the concentration‐time curve from time 0 to the time of the last quantifiable concentration (AUClast).
Official websites use .gov
A
.gov website belongs to an official
government organization in the United States.
Secure .gov websites use HTTPS
A lock (
) or https:// means you've safely
connected to the .gov website. Share sensitive
information only on official, secure websites.
Scatter plots of individual and median values for (A) maximum unbound serum evolocumab concentration (Cmax) and (B) area under the concentration‐time curve from time 0 to the time of the last quantifiable concentration (AUClast).